
Nifty OI Profile
Overview
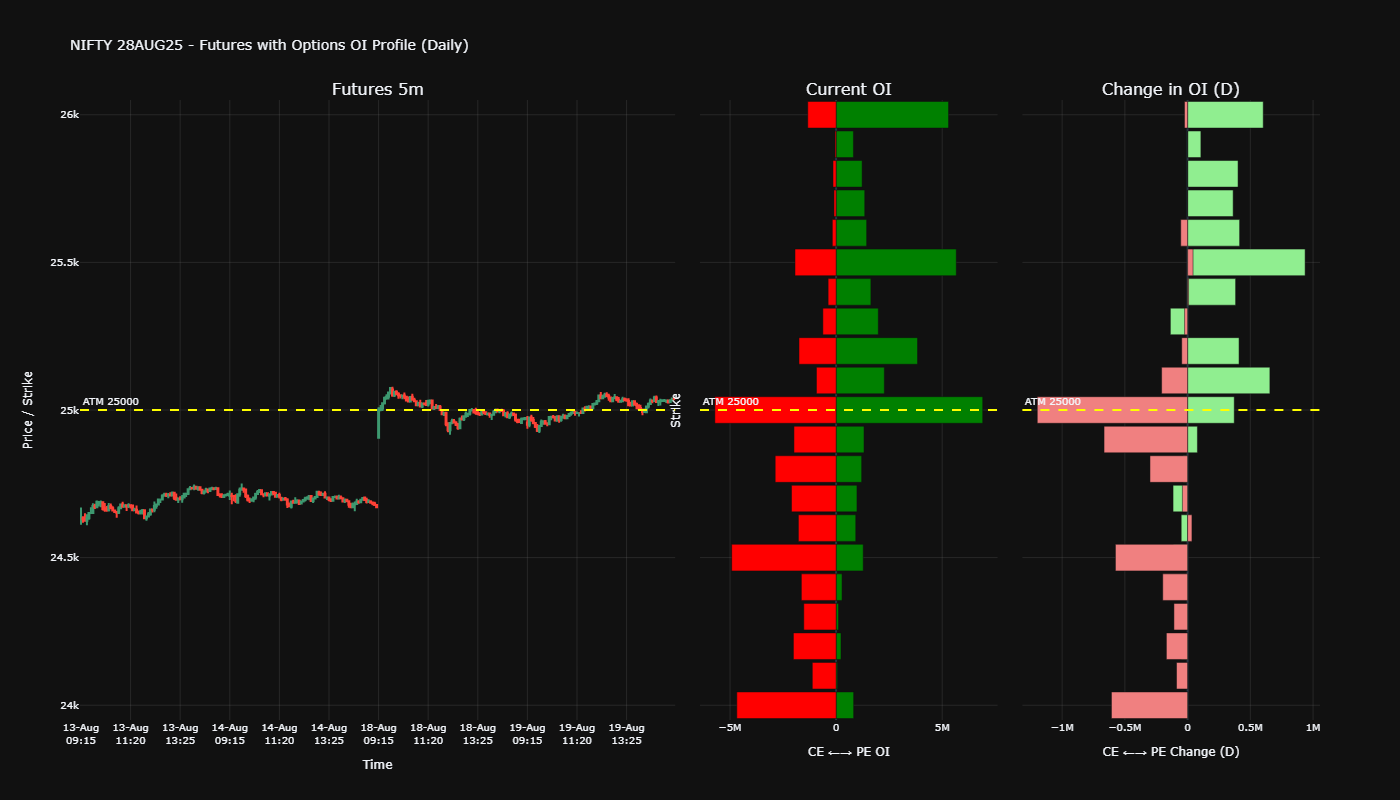
This application generates a comprehensive Options Open Interest (OI) profile for NIFTY futures and options contracts, providing traders with real-time insights into market sentiment and positioning. The tool combines futures price action with options flow analysis to deliver actionable trading intelligence.
Purpose
The OI Profile serves as a critical tool for derivatives traders to:
- Identify key support and resistance levels based on option positioning
- Gauge market sentiment through CE/PE activity analysis
- Monitor institutional flow via daily OI changes
- Correlate price movement with options positioning patterns
"""
NIFTY 28 AUG 2025 - Futures (5m, 7 days) + Options OI Profile (DAILY)
Author  : Tradeboard GPT
Updated : 2025-08-19
Notes   : - Options OI (both Current OI and 1D change) is read ONLY from 1D history
          - No option quotes are used for OI; no intraday fallback
          - Futures panel is 5m, last 7 calendar days
          - Plotly candlestick x-axis uses category type (as required)
          - Timezone-aware comparisons throughout
"""

print("Tradeboard Python Bot is running.")

import os, sys, re, time, asyncio, numpy as np, pandas as pd
from datetime import datetime, timedelta
import plotly.graph_objects as go
from plotly.subplots import make_subplots
from tradeboard import api

# --------------------------------- CONFIG ---------------------------------
API_KEY  = 'your-tradeboard-apikey'
API_HOST = "http://127.0.0.1:5000"

BASE          = "NIFTY"
EXPIRY        = "28AUG25"           # same expiry for FUT + OI profile
EXCHANGE_IDX  = "NSE_INDEX"         # for ATM reference (quotes printed per rule 14)
EXCHANGE_FUT  = "NFO"               # futures candles only
EXCHANGE_OPT  = "NFO"               # options history (DAILY)

CANDLE_INTERVAL = "5m"              # futures candles
CANDLE_DAYS     = 7                 # last 7 calendar days

STEP          = 100                 # strike step
RADIUS        = 10                  # ± strikes around ATM (increased for better OI profile)
BATCH_SIZE    = 10                  # batched daily-history requests
BATCH_PAUSE   = 2
MAX_RETRIES   = 1
BACKOFF_SEC   = 1.0

# ------------------------------ INIT CLIENT -------------------------------
client = api(api_key=API_KEY, host=API_HOST)
if sys.platform.startswith("win"):
    asyncio.set_event_loop_policy(asyncio.WindowsSelectorEventLoopPolicy())

# ----------------------------- SYMBOL HELPERS -----------------------------
FUT_SYMBOL = f"{BASE}{EXPIRY}FUT"  # e.g., NIFTY28AUG25FUT  (for candles only)
_rx_opt = re.compile(r"^([A-Z]+)(\d{2}[A-Z]{3}\d{2})(\d+)(CE|PE)$")

def parse_option(sym: str):
    m = _rx_opt.match(sym)
    if not m: return None
    base, expiry, strike, typ = m.groups()
    return base, expiry, int(strike), typ

def get_atm_strike(step: int = STEP) -> int:
    """Use the NSE_INDEX quote to compute the nearest 100-pt ATM."""
    q = client.quotes(symbol=BASE, exchange=EXCHANGE_IDX)
    print("Underlying Quote :", q)
    ltp = q["data"]["ltp"]
    return int(round(ltp / step) * step)

# --------------------------- HISTORY NORMALIZER ---------------------------
def _parse_epoch_like(s: pd.Series) -> pd.DatetimeIndex:
    """Detect ms vs s epoch and parse safely; fallback to strings."""
    s_num = pd.to_numeric(s, errors="coerce")
    if s_num.notna().any():
        mx = float(np.nanmax(s_num.values))
        if mx > 1e12:  # ms
            dt = pd.to_datetime(s_num, unit="ms", errors="coerce")
            if dt.notna().any(): return dt
        if mx > 1e9:   # s
            dt = pd.to_datetime(s_num, unit="s", errors="coerce")
            if dt.notna().any(): return dt
    return pd.to_datetime(s.astype(str), errors="coerce")

def _history_as_df(resp) -> pd.DataFrame | None:
    """
    Normalize Tradeboard history response to a DataFrame.
    Handles: DataFrame, dict{'data':[...]} or {'data':{'candles':[...]}} or raw list.
    """
    if resp is None: return None
    if isinstance(resp, pd.DataFrame):
        df = resp.copy()
    elif isinstance(resp, dict):
        data = resp.get("data")
        rows = data if isinstance(data, list) else (data.get("candles") if isinstance(data, dict) else None)
        if rows is None: return None
        if rows and isinstance(rows[0], (list, tuple)):
            cols = ["time","open","high","low","close","volume","oi"][:len(rows[0])]
            df = pd.DataFrame(rows, columns=cols)
        else:
            df = pd.DataFrame(rows)
    elif isinstance(resp, list):
        df = pd.DataFrame(resp)
    else:
        return None

    # index by timestamp if present
    ts_col = next((c for c in ["time","timestamp","date","datetime","ts","Time","Date"] if c in df.columns), None)
    if ts_col is not None:
        vals = df[ts_col]
        if pd.api.types.is_numeric_dtype(vals):
            idx = _parse_epoch_like(vals)
        else:
            idx = pd.to_datetime(vals, errors="coerce")
        if idx.notna().any():
            df.index = idx
    return df

def _find_oi_col(df: pd.DataFrame) -> str | None:
    names = [c for c in df.columns if isinstance(c, str)]
    for key in ("oi","open_interest","oi_close","oi_open","openinterest"):
        for c in names:
            if c.lower() == key: return c
    for c in names:
        if "oi" in c.lower(): return c
    return None

# ------------- DAILY OI for a single option (current & prev) --------------
def fetch_daily_oi_sync(symbol: str) -> dict | None:
    """
    Get CURRENT OI (last daily bar) and PREVIOUS OI (bar -1) strictly from DAILY history.
    Returns dict with strike, type, CE/PE OI, Daily delta, and (optional) last daily close for hover.
    """
    # fetch only daily bars using start/end dates
    end = datetime.now().date()
    start = end - timedelta(days=14)
    df = None
    for _ in range(MAX_RETRIES + 1):
        try:
            resp = client.history(
                symbol=symbol, exchange=EXCHANGE_OPT, interval="D",
                start_date=start.strftime("%Y-%m-%d"),
                end_date=end.strftime("%Y-%m-%d")
            )
            df = _history_as_df(resp)
            if df is not None and not df.empty:
                break
        except Exception as e:
            print(f"Error fetching {symbol}: {e}")
            time.sleep(BACKOFF_SEC)
            continue
        time.sleep(BACKOFF_SEC)

    if df is None or df.empty:
        return None

    oi_col = _find_oi_col(df)
    if not oi_col:
        return None

    s = pd.to_numeric(df[oi_col], errors="coerce").dropna()
    if not len(s):
        return None

    cur_oi = float(s.iloc[-1])
    prev_oi = float(s.iloc[-2]) if len(s) >= 2 else None
    delta_d = (cur_oi - prev_oi) if prev_oi is not None else None

    # optional: last daily close for hover
    close_col = "close" if "close" in df.columns else ("c" if "c" in df.columns else None)
    ltp = float(pd.to_numeric(df[close_col], errors="coerce").dropna().iloc[-1]) if close_col else None

    base, expiry, strike, typ = parse_option(symbol)
    return {"symbol": symbol, "strike": strike, "type": typ,
            "oi": cur_oi, "oi_delta_d": delta_d, "ltp": ltp}

# -------------------- GATHER DAILY OI for all strikes ---------------------
async def gather_daily_oi_for_expiry() -> pd.DataFrame:
    atm = get_atm_strike()
    strikes = [atm + i * STEP for i in range(-RADIUS, RADIUS + 1)]
    symbols = [f"{BASE}{EXPIRY}{k}{s}" for k in strikes for s in ("CE", "PE")]

    rows: list[dict] = []
    for i in range(0, len(symbols), BATCH_SIZE):
        batch = symbols[i:i + BATCH_SIZE]
        res = await asyncio.gather(*[
            asyncio.to_thread(fetch_daily_oi_sync, s) for s in batch
        ])
        rows.extend([r for r in res if r])
        if i + BATCH_SIZE < len(symbols):
            await asyncio.sleep(BATCH_PAUSE)

    if not rows:
        raise RuntimeError("No DAILY OI retrieved. Check API/expiry.")

    df = pd.DataFrame(rows)
    piv = (df.pivot(index="strike", columns="type", values=["oi", "oi_delta_d", "ltp"])
             .sort_index())
    piv.columns = ["CE_OI", "PE_OI", "CE_OI_D", "PE_OI_D", "CE_LTP", "PE_LTP"]
    return piv.reset_index().fillna(0)  # Fill NaN with 0 for cleaner display

# ------------- FUTURES HISTORY (5m, LAST 7 DAYS, CATEGORY X) --------------
def get_fut_history_5m_7d():
    end_dt = datetime.now()
    start_dt = end_dt - timedelta(days=CANDLE_DAYS)

    resp = client.history(
        symbol=FUT_SYMBOL, exchange=EXCHANGE_FUT, interval=CANDLE_INTERVAL,
        start_date=start_dt.strftime("%Y-%m-%d"),
        end_date=end_dt.strftime("%Y-%m-%d")
    )
    df = _history_as_df(resp)
    if df is None or df.empty:
        raise ValueError(f"History fetch failed for {FUT_SYMBOL}")

    # Standardize OHLC field names
    rename = {}
    for k in ("o","h","l","c"):
        if k in df.columns: rename[k] = {"o":"open","h":"high","l":"low","c":"close"}[k]
    df = df.rename(columns=rename)
    for need in ("open","high","low","close"):
        if need not in df.columns and need.capitalize() in df.columns:
            df = df.rename(columns={need.capitalize(): need})

    # Ensure datetime index and filter window
    if not isinstance(df.index, pd.DatetimeIndex):
        df.index = pd.to_datetime(df.index, errors="coerce")
    df = df.sort_index()

    # FIX: Handle timezone-aware comparison properly
    cutoff_time = pd.Timestamp(end_dt) - pd.Timedelta(days=CANDLE_DAYS)

    # Convert cutoff to match DataFrame timezone if needed
    if df.index.tz is not None and cutoff_time.tz is None:
        cutoff_time = cutoff_time.tz_localize(df.index.tz)
    elif df.index.tz is None and cutoff_time.tz is not None:
        cutoff_time = cutoff_time.tz_localize(None)

    df = df.loc[df.index >= cutoff_time]

    # x as category strings (Plotly rule)
    x_cat = df.index.strftime('%d-%b<br>%H:%M').tolist()
    total = len(x_cat)
    tick_step = max(1, total // 12)
    tick_vals = [x_cat[i] for i in range(0, total, tick_step)]
    return df, x_cat, tick_vals

# ---------------------- PLOTTING (OI Profile Style) -----------------------
def plot_oi_profile_style(fut_df: pd.DataFrame, fut_x: list[str], fut_ticks: list[str], oi_df: pd.DataFrame):
    """
    Create an OI profile with:
    Column 1: Candlestick Charts
    Column 2: Current OI
    Column 3: Change in OI (Daily)
    """
    atm = get_atm_strike()

    # Filter strikes closer to ATM for better visualization
    oi_df_filtered = oi_df[
        (oi_df['strike'] >= atm - 1000) &
        (oi_df['strike'] <= atm + 1000)
    ].copy()

    # Create subplots with 3 columns
    fig = make_subplots(
        rows=1, cols=3,
        shared_yaxes=True,
        horizontal_spacing=0.02,
        column_widths=[0.5, 0.25, 0.25],
        specs=[[{"type": "candlestick"}, {"type": "bar"}, {"type": "bar"}]],
        subplot_titles=["Futures 5m", "Current OI", "Change in OI (D)"]
    )

    # COLUMN 1: Futures candlestick
    fig.add_trace(
        go.Candlestick(
            x=fut_x,
            open=fut_df["open"],
            high=fut_df["high"],
            low=fut_df["low"],
            close=fut_df["close"],
            name=f"{BASE} {EXPIRY} FUT",
            showlegend=False
        ),
        row=1, col=1
    )

    # COLUMN 2: Current OI
    fig.add_trace(
        go.Bar(
            y=oi_df_filtered["strike"],
            x=oi_df_filtered["CE_OI"],
            orientation="h",
            name="CE OI",
            marker_color="green",
            hovertemplate="<b>%{y} CE</b><br>Current OI: %{x:,.0f}<extra></extra>",
            showlegend=False
        ),
        row=1, col=2
    )

    fig.add_trace(
        go.Bar(
            y=oi_df_filtered["strike"],
            x=-oi_df_filtered["PE_OI"],  # Negative for left side
            orientation="h",
            name="PE OI",
            marker_color="red",
            hovertemplate="<b>%{y} PE</b><br>Current OI: %{customdata:,.0f}<extra></extra>",
            customdata=oi_df_filtered["PE_OI"],
            showlegend=False
        ),
        row=1, col=2
    )

    # COLUMN 3: Change in OI (Daily)
    fig.add_trace(
        go.Bar(
            y=oi_df_filtered["strike"],
            x=oi_df_filtered["CE_OI_D"],
            orientation="h",
            name="CE Change (D)",
            marker_color="lightgreen",
            hovertemplate="<b>%{y} CE</b><br>Δ OI (D): %{x:,.0f}<extra></extra>",
            showlegend=False
        ),
        row=1, col=3
    )

    fig.add_trace(
        go.Bar(
            y=oi_df_filtered["strike"],
            x=-oi_df_filtered["PE_OI_D"],  # Negative for left side
            orientation="h",
            name="PE Change (D)",
            marker_color="lightcoral",
            hovertemplate="<b>%{y} PE</b><br>Δ OI (D): %{customdata:,.0f}<extra></extra>",
            customdata=oi_df_filtered["PE_OI_D"],
            showlegend=False
        ),
        row=1, col=3
    )

    # Layout updates
    fig.update_layout(
        template="plotly_dark",
        height=800,
        width=1400,
        title=f"{BASE} {EXPIRY} - Futures with Options OI Profile (Daily)",
        barmode="overlay",
        bargap=0.1,
        font=dict(size=10),
        # Remove bottom slider/rangeslider
        xaxis=dict(rangeslider=dict(visible=False)),
        xaxis2=dict(rangeslider=dict(visible=False)),
        xaxis3=dict(rangeslider=dict(visible=False))
    )

    # Update axes
    fig.update_xaxes(title_text="Time", type="category",
                     tickmode="array", tickvals=fut_ticks,
                     rangeslider=dict(visible=False), row=1, col=1)
    fig.update_xaxes(title_text="CE / PE OI", row=1, col=2)
    fig.update_xaxes(title_text="CE / PE Change (D)", row=1, col=3)

    # Y-axes labels
    fig.update_yaxes(title_text="Price / Strike", row=1, col=1)
    fig.update_yaxes(title_text="Strike", row=1, col=2)
    fig.update_yaxes(title_text="", row=1, col=3)

    # Add ATM line across all subplots
    fig.add_hline(
        y=atm,
        line_dash="dash",
        line_color="yellow",
        line_width=2,
        annotation_text=f"ATM {atm}",
        annotation_position="top left"
    )

    # Add grid lines for better readability
    fig.update_yaxes(showgrid=True, gridwidth=1, gridcolor='rgba(128,128,128,0.2)')
    fig.update_xaxes(showgrid=True, gridwidth=1, gridcolor='rgba(128,128,128,0.2)')

    fig.show()

# --------------------------------- RUNNER ---------------------------------
async def _main():
    try:
        print("Fetching futures data...")
        fut_df, x_cat, ticks = get_fut_history_5m_7d()       # 5m, 7 days
        print(f"Got {len(fut_df)} futures candles")

        print("Fetching options OI data...")
        oi_df = await gather_daily_oi_for_expiry()           # DAILY options OI ONLY
        print(f"Got OI data for {len(oi_df)} strikes")

        print("Creating OI profile chart...")
        plot_oi_profile_style(fut_df, x_cat, ticks, oi_df)
        print("Chart displayed successfully!")

    except Exception as e:
        print(f"Error in main execution: {e}")
        import traceback
        traceback.print_exc()

def _in_nb() -> bool:
    try:
        import IPython; return IPython.get_ipython() is not None
    except ImportError:
        return False

if _in_nb():
    asyncio.ensure_future(_main())  # Jupyter already runs an event loop
else:
    asyncio.run(_main())
Data Sources
- Futures Data: 5-minute candlestick charts spanning the last 7 calendar days
- Options Data: Daily Open Interest data for both Call (CE) and Put (PE) options
- Strike Range: 10 strikes above and below At-The-Money (ATM) (
RADIUS), with 100-point intervals (STEP) - Expiry: Focused on current monthly expiry (28AUG25)
Visual Layout
The application presents data in a three-column dashboard:
Column 1 (50% width): Futures candlestick chart showing 5-minute price action over 7 days, providing context for recent price movement and trend analysis.
Column 2 (25% width): Current Open Interest levels displaying existing market positions, with Call options extending right (green) and Put options extending left (red) for easy visual comparison.
Column 3 (25% width): Daily OI changes showing new positioning activity, highlighting where fresh money is entering or exiting the market on a daily basis.
Key Features
- Real-time ATM calculation using live NIFTY index quotes
- Timezone-aware data processing for accurate historical comparisons
- Batch processing for efficient API utilization with rate limiting
- Interactive hover details showing exact OI values and changes
- Professional dark theme optimized for trading environments
- ATM highlighting with yellow reference line across all panels