
NIFTY Open Interest
Overview
This python code fetches and visualizes Open Interest (OI) profile for NIFTY options, helping traders identify support and resistance levels based on options market data.
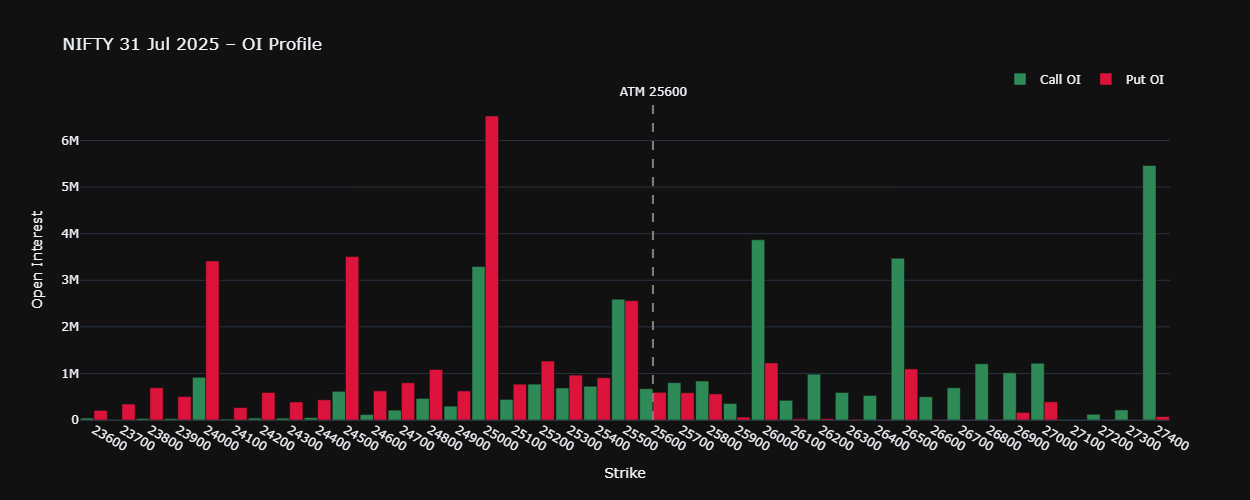
Features
- Real-time OI data for Call and Put options
- Automatic ATM strike calculation
- Batch processing with rate limiting
- Interactive Plotly visualization
- Error handling with retry logic
Full Python Code
python
"""
NIFTY 28 AUG 2025 - OI profile (10-req/s batches)
Author  : Tradeboard GPT
Updated : 2025-06-28
"""

print("Tradeboard Python Bot is running.")

import os, sys, re, time, asyncio, pandas as pd, plotly.graph_objects as go
from datetime import datetime
from tradeboard import api

# ------------------------- CONFIG (edit to suit) --------------------------
API_KEY  = os.getenv("TRADEBOARD_API_KEY",  "tradeboard-api-key")
API_HOST = os.getenv("TRADEBOARD_API_HOST", "http://127.0.0.1:5000")

EXPIRY        = "28AUG25"      # option expiry (DDMMMYY)
RADIUS        = 20             # strikes above and below ATM
STEP          = 100            # 100-pt strike interval
BATCH_SIZE    = 10             # quotes per batch
BATCH_PAUSE   = 2           # seconds to wait between batches
MAX_RETRIES   = 1              # one retry on 429 / timeout
BACKOFF_SEC   = 1.2

client = api(api_key=API_KEY, host=API_HOST)
if sys.platform.startswith("win"):
    asyncio.set_event_loop_policy(asyncio.WindowsSelectorEventLoopPolicy())

# -------------------------------- Helpers ---------------------------------
def get_atm_strike(step: int = STEP) -> int:
    q = client.quotes(symbol="NIFTY", exchange="NSE_INDEX")
    print("Underlying Quote :", q)
    return int(round(q["data"]["ltp"] / step) * step)

_sym_rx = re.compile(r"^[A-Z]+(\d{2}[A-Z]{3}\d{2})(\d+)(CE|PE)$")
def parse_symbol(sym: str):
    m = _sym_rx.match(sym)
    return (int(m.group(2)), m.group(3)) if m else None

def fetch_sync(sym: str) -> dict | None:
    """Blocking quote call with a retry for 429 / timeout."""
    for attempt in range(MAX_RETRIES + 1):
        q = client.quotes(symbol=sym, exchange="NFO")
        print(sym, "->", q)
        if q.get("status") == "success":
            parsed = parse_symbol(sym)
            if parsed is None:
                print("Bad symbol", sym)
                return None
            strike, opt = parsed
            return dict(strike=strike, type=opt,
                        oi=q["data"]["oi"], ltp=q["data"]["ltp"])
        if (q.get("code") == 429 or q.get("error_type") == "timeout_error") and attempt < MAX_RETRIES:
            time.sleep(BACKOFF_SEC)
    return None

# ------------------- Batch-paced gather (about 5 req/s) -------------------
async def gather_df() -> pd.DataFrame:
    atm = get_atm_strike()
    strikes = [atm + i*STEP for i in range(-RADIUS, RADIUS + 1)]
    symbols = [f"NIFTY{EXPIRY}{k}{s}" for k in strikes for s in ("CE", "PE")]

    rows: list[dict] = []
    for i in range(0, len(symbols), BATCH_SIZE):
        batch = symbols[i:i+BATCH_SIZE]
        res   = await asyncio.gather(*[asyncio.to_thread(fetch_sync, s) for s in batch])
        rows.extend(r for r in res if r)
        if i + BATCH_SIZE < len(symbols):
            await asyncio.sleep(BATCH_PAUSE)          # pace: 10 quotes / 2s

    if not rows:
        raise RuntimeError("All quotes failed - check API / symbols.")
    return pd.DataFrame(rows)

# ------------- Plot (Call = green, Put = red, both positive) --------------
def plot_oi(df: pd.DataFrame):
    piv = (df.pivot(index="strike", columns="type", values=["oi", "ltp"])
             .sort_index())
    piv.columns = ["CE_OI", "PE_OI", "CE_LTP", "PE_LTP"]
    piv = piv.reset_index()

    fig = go.Figure()
    fig.add_bar(
        x=piv["strike"], y=piv["CE_OI"],          # no minus sign
        name="Call OI", marker_color="seagreen",
        customdata=piv[["CE_OI", "CE_LTP"]],
        hovertemplate="<b>%{x} CE</b><br>OI %{customdata[0]:,}"
                      "<br>LTP Rs.%{customdata[1]:.2f}<extra></extra>"
    )
    fig.add_bar(
        x=piv["strike"], y=piv["PE_OI"],
        name="Put OI", marker_color="crimson",
        customdata=piv[["PE_OI", "PE_LTP"]],
        hovertemplate="<b>%{x} PE</b><br>OI %{customdata[0]:,}"
                      "<br>LTP Rs.%{customdata[1]:.2f}<extra></extra>"
    )
    atm = get_atm_strike()
    fig.add_vline(
        x=piv.index[piv["strike"] == atm][0],
        line_dash="dash", line_color="gray",
        annotation_text=f"ATM {atm}", annotation_position="top"
    )
    fig.update_layout(
        title=f"NIFTY {datetime.strptime(EXPIRY,'%d%b%y').strftime('%d %b %Y')} - OI Profile",
        xaxis=dict(title="Strike", type="category"),
        yaxis_title="Open Interest",
        bargap=0.05, template="plotly_dark",
        height=500, width=1250,
        legend=dict(orientation="h", yanchor="bottom", y=1.02,
                    xanchor="right", x=1)
    )
    fig.show()

# ----------------------- Runner (script / notebook) -----------------------
async def _main():
    df = await gather_df()
    print(df.head())
    plot_oi(df)

def _in_nb() -> bool:
    try:
        import IPython
        return IPython.get_ipython() is not None
    except ImportError:
        return False

if _in_nb():
    asyncio.ensure_future(_main())  # Jupyter already runs an event loop
else:
    asyncio.run(_main())            # script
Full Code Explaination
Configuration
Environment Variables
python
TRADEBOARD_API_KEY  = "your_api_key_here"
TRADEBOARD_API_HOST = "http://127.0.0.1:5000"
Parameters
python
EXPIRY        = "28AUG25"      # Option expiry date (DDMMMYY format)
RADIUS        = 20             # Number of strikes above/below ATM
STEP          = 100            # Strike price interval
BATCH_SIZE    = 10             # API requests per batch
BATCH_PAUSE   = 2              # Seconds between batches
MAX_RETRIES   = 1              # Retry attempts for failed requests
BACKOFF_SEC   = 1.2           # Backoff time for retries
Code Structure
1. ATM Strike Calculation
python
def get_atm_strike(step: int = STEP) -> int:
    q = client.quotes(symbol="NIFTY", exchange="NSE_INDEX")
    return int(round(q["data"]["ltp"] / step) * step)
Fetches current NIFTY spot price and rounds to nearest strike.
2. Symbol Parsing
python
_sym_rx = re.compile(r"^[A-Z]+(\d{2}[A-Z]{3}\d{2})(\d+)(CE|PE)$")
def parse_symbol(sym: str):
    m = _sym_rx.match(sym)
    return (int(m.group(2)), m.group(3)) if m else None
Extracts strike price and option type from symbol string.
3. Quote Fetching
python
def fetch_sync(sym: str) -> dict | None:
    for attempt in range(MAX_RETRIES + 1):
        q = client.quotes(symbol=sym, exchange="NFO")
        if q.get("status") == "success":
            parsed = parse_symbol(sym)
            if parsed is None:
                return None
            strike, opt = parsed
            return dict(strike=strike, type=opt,
                        oi=q["data"]["oi"], ltp=q["data"]["ltp"])
        if (q.get("code") == 429 or q.get("error_type") == "timeout_error") and attempt < MAX_RETRIES:
            time.sleep(BACKOFF_SEC)
    return None
Fetches quote data with retry logic for rate limits and timeouts.
4. Batch Data Collection
python
async def gather_df() -> pd.DataFrame:
    atm = get_atm_strike()
    strikes = [atm + i*STEP for i in range(-RADIUS, RADIUS + 1)]
    symbols = [f"NIFTY{EXPIRY}{k}{s}" for k in strikes for s in ("CE", "PE")]

    rows: list[dict] = []
    for i in range(0, len(symbols), BATCH_SIZE):
        batch = symbols[i:i+BATCH_SIZE]
        res = await asyncio.gather(*[asyncio.to_thread(fetch_sync, s) for s in batch])
        rows.extend(r for r in res if r)
        if i + BATCH_SIZE < len(symbols):
            await asyncio.sleep(BATCH_PAUSE)

    return pd.DataFrame(rows)
Processes symbols in batches to respect API rate limits.
5. Visualization
python
def plot_oi(df: pd.DataFrame):
    piv = df.pivot(index="strike", columns="type", values=["oi", "ltp"]).sort_index()
    piv.columns = ["CE_OI", "PE_OI", "CE_LTP", "PE_LTP"]

    fig = go.Figure()

    # Call OI - Green bars
    fig.add_bar(
        x=piv["strike"], y=piv["CE_OI"],
        name="Call OI", marker_color="seagreen",
        customdata=piv[["CE_OI", "CE_LTP"]],
        hovertemplate="<b>%{x} CE</b><br>OI %{customdata[0]:,}<br>LTP Rs.%{customdata[1]:.2f}"
    )

    # Put OI - Red bars
    fig.add_bar(
        x=piv["strike"], y=piv["PE_OI"],
        name="Put OI", marker_color="crimson",
        customdata=piv[["PE_OI", "PE_LTP"]],
        hovertemplate="<b>%{x} PE</b><br>OI %{customdata[0]:,}<br>LTP Rs.%{customdata[1]:.2f}"
    )

    # ATM line
    atm = get_atm_strike()
    fig.add_vline(
        x=piv.index[piv["strike"] == atm][0],
        line_dash="dash", line_color="gray",
        annotation_text=f"ATM {atm}"
    )

    fig.update_layout(
        title=f"NIFTY {datetime.strptime(EXPIRY,'%d%b%y').strftime('%d %b %Y')} - OI Profile",
        xaxis=dict(title="Strike", type="category"),
        yaxis_title="Open Interest",
        bargap=0.05, template="plotly_dark",
        height=500, width=1250
    )

    fig.show()
Creates interactive bar chart with hover details.
Usage
In Jupyter Notebook
python
# Run all cells to generate the OI profile.
# The runner detects the notebook and schedules _main() on the running loop.
await _main()
As Python Script
bash
python NiftyOI.pyOutput
The script generates:
- Interactive Plotly chart
- Green bars for Call OI
- Red bars for Put OI
- Gray dashed line for ATM strike
- Hover tooltips showing OI and LTP values
Error Handling
- 429 errors: Automatic retry with backoff
- Timeout errors: Retry with MAX_RETRIES limit
- Invalid symbols: Skipped with warning
- API failures: Graceful degradation
Data Structure
Output DataFrame contains:
strike: Strike pricetype: Option type (CE/PE)oi: Open Interestltp: Last Traded Price